Venue
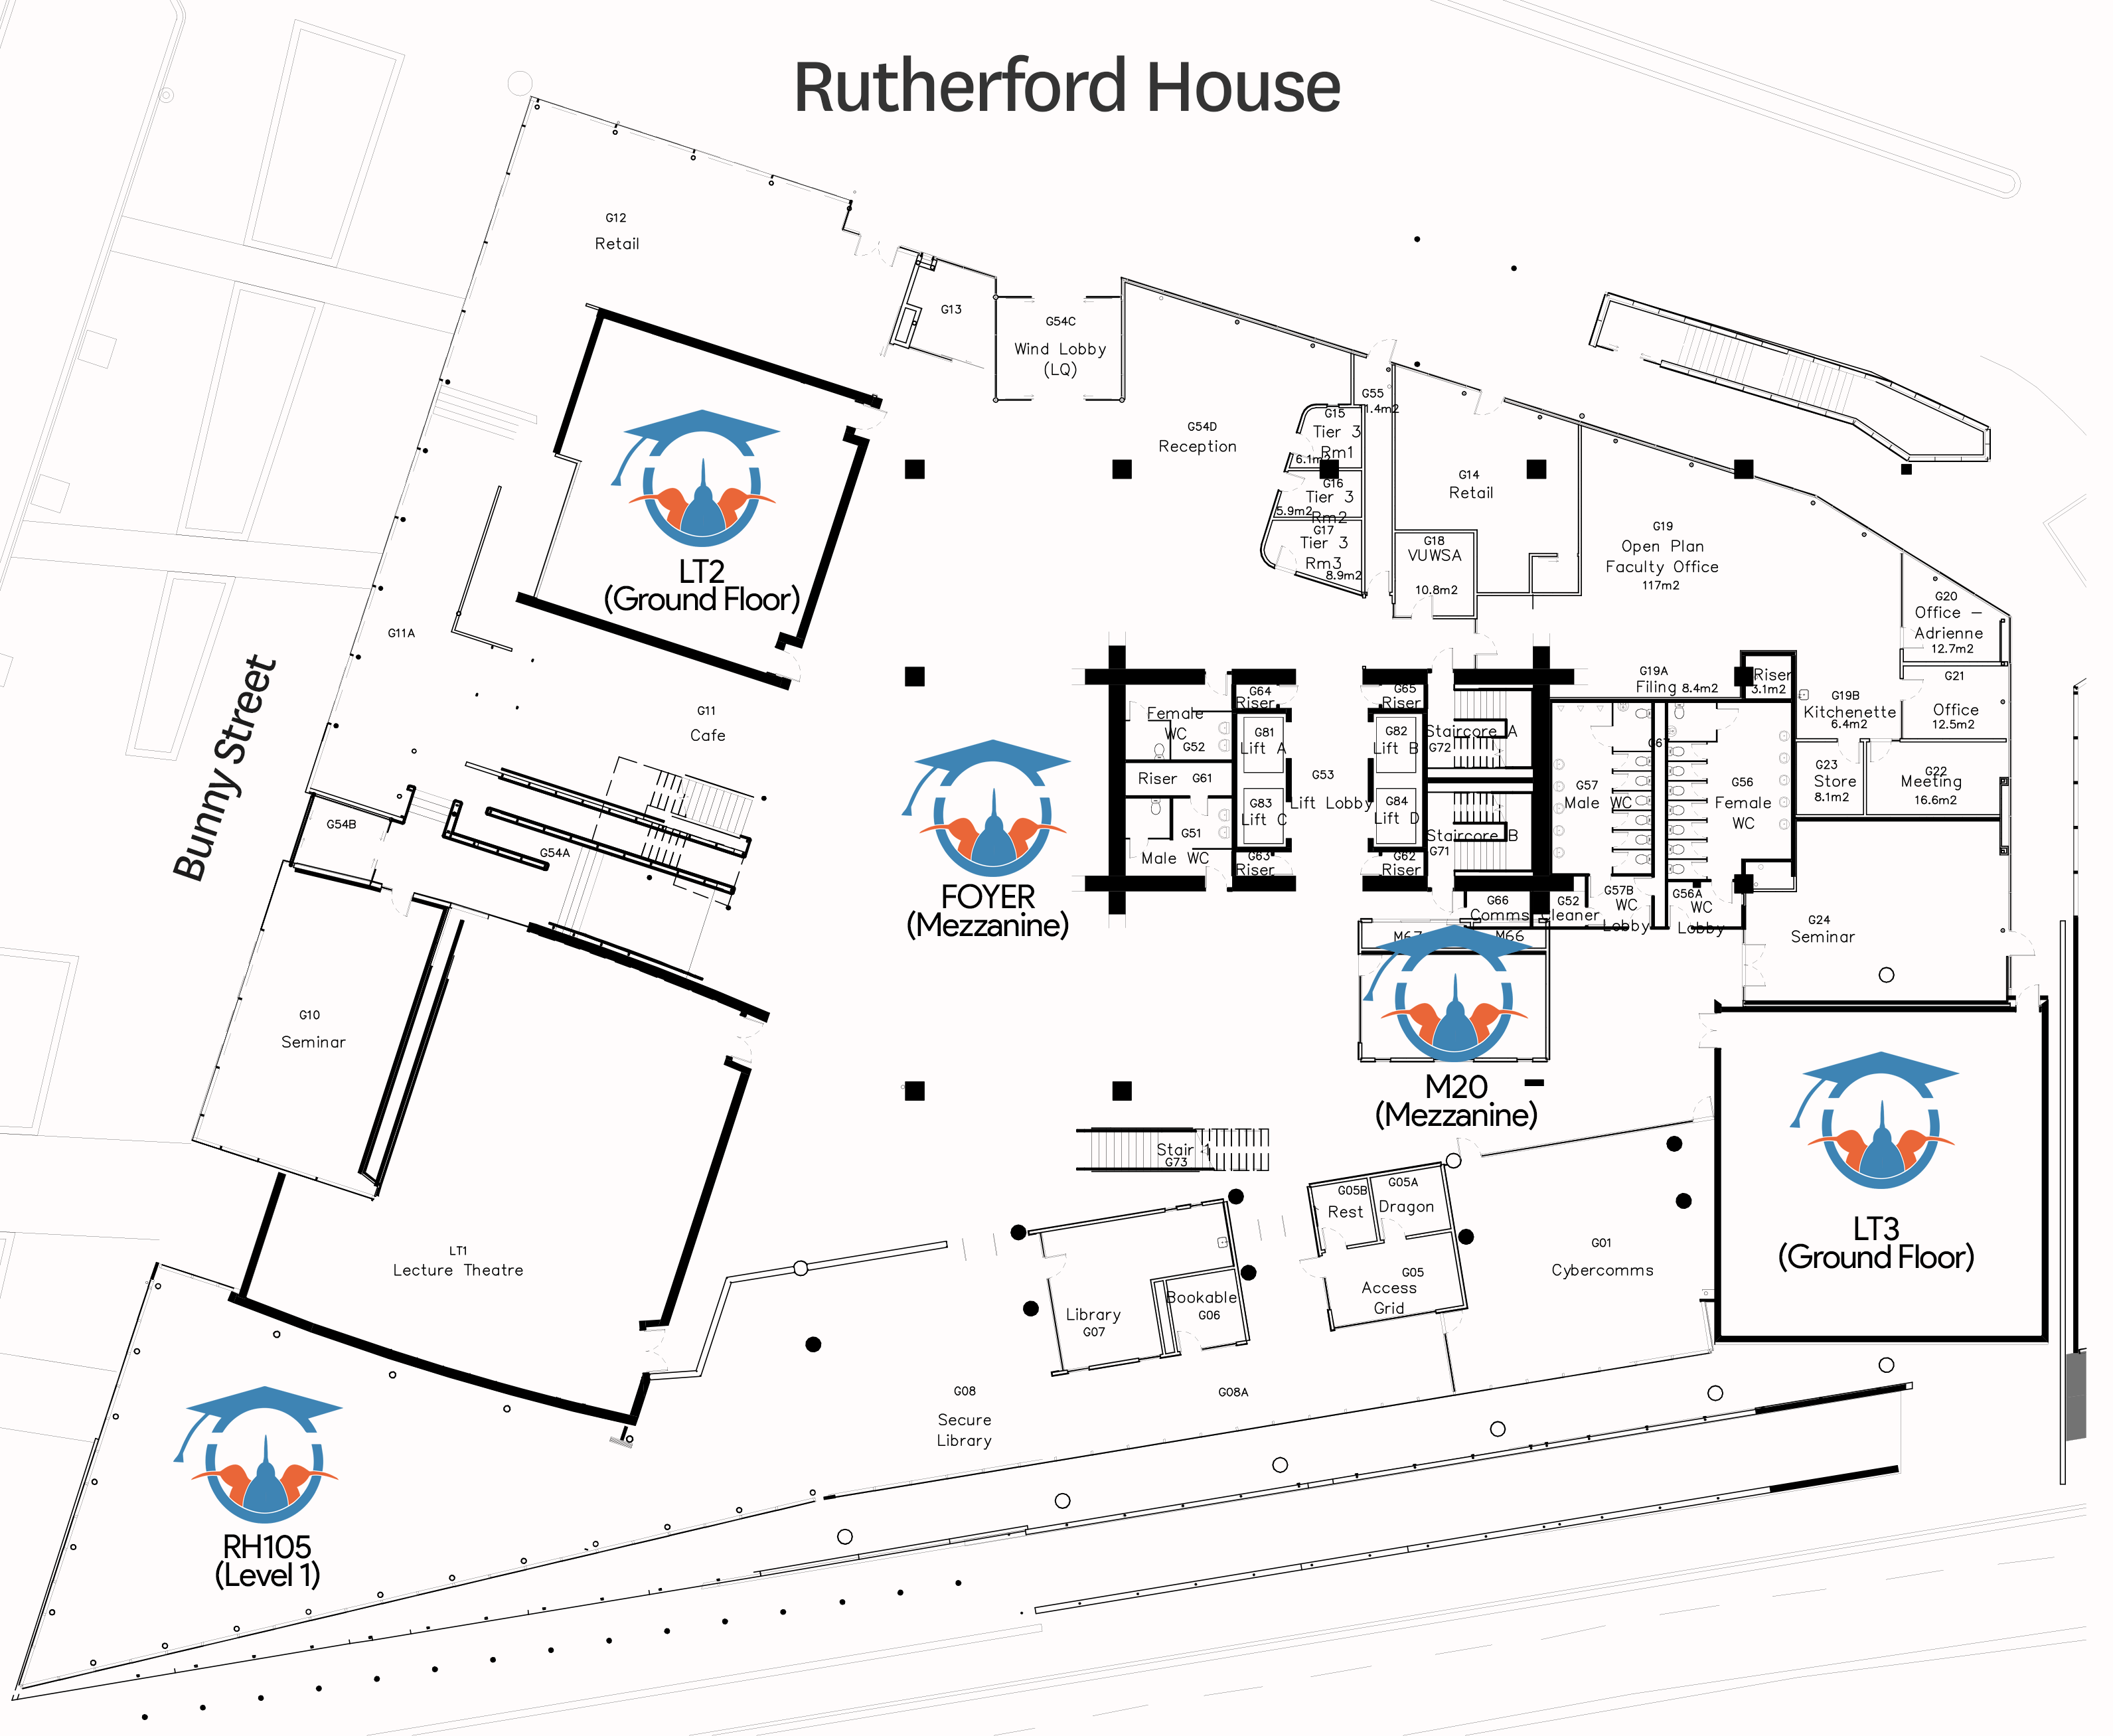
ResBazWelli will be held in Rutherford House on Victoria University of Wellington's Pipitea Campus, in the mezzanine foyer and surrounding spaces.
Come Along
Sessions
Sessions marked with an asterix (*) have updated links and information
Data visualisation for communication is a bit different from exploratory data analysis. In this workshop led by Harkanwal Sign, we will explore examples of compelling data narratives and what makes visualisation work for the audience. Also, the workshop will focus on the design process outside of the code, including sketching data visualisation and learning how to use colour better.
Data visualization is an important tool for the 21st century, assisting in both data analysis and the communication of results. The use of appropriate visualization techniques can greatly increase the ability to gain insight from data. This workshop will give an introduction to data visualization using different tools and techniques, and use of visual variables to make effective visualizations. Come prepared with your own datasets that you want to visualize!
See an example created after this session by Lehlya Heward, of the Department of Chinese Studies in the School of Languages and Cultures, here .
Increasingly, publishers are requesting short videos to accompany articles and research projects. In this session, you'll get an overview of what video abstracts are, why they're useful, and how you can create one - from storyboarding to filming to editing.
Stuart Yeats leads a discussion about wikipedia use in teaching and research in university contexts, including setting editing as coursework, adding your research results to wikipedia and using wikipedia as data. In the second half of the session, Stuart will talk his way through the creation of a new wikipedia article, explaining what he's doing, why he's doing it and how to avoid common mistakes.
Related links: Wikipedia Authority Control | NZ Research | Wikimedia Projects.
LaTeX is a document preparation system for high-quality typesetting that allows you to separate the content from the format of your document. It is most often used for medium-to-large technical or scientific documents but it can be used for almost any form of publishing. Come along to see if it's for you.
This session will offer a brief and practical introduction to Git and GitHub for complete beginners. Learn how you can use Git to manage and keep track of different versions of all your important files and documents that change through time in your projects. GitHub is one of the worlds leading online collaboration platforms for working on projects that use Git. Whether you write code or not, Git and GitHub are incredibly powerful tools that should be part of any researchers digital toolkit. Come and see what it's all about!
Python is a widely-used, easily-learned general-purpose language. It can be used to automate tasks, analyse data and build just about anything.This hands-on lesson will focus on how Python can be used for scientific data analysis (CODE stream only).
R is a free, widely-used and well-documented software environment for data science. The best way to learn how to program is to do something useful, so this introduction to R is built around a common scientific task: data analysis. The goal isn’t just to teach you R, but also the basic concepts that all programming depends on. (CODE stream only).
No one likes doing boring tasks once, let alone many times over and over. The Unix Shell allows you to do complex things with just a few keystrokes. More importantly, it helps you combine existing programs in new ways and automate repetitive tasks. (CODE stream only).
Dickens and Data Science
Connected Worlds
fab lab wgtn
data.govt.nz
Timetable
WEDS JULY 4th
Note: only CODE stream sessions are offered on this day.
Make sure to check out this website for installation instuctions and further key info.
THURS JULY 5th
*Sessions marked with an asterix only available to those registered for the CODE stream.
More information on sessions for both streams can be found here.
FRI JULY 6 th
*Sessions marked with an asterix only available to those registered for the CODE stream.
More information on sessions for both streams can be found here.
Meet Our Speakers
Kylie Reiri Kylie is a data scientist who has a keen interest in making it easier to work with data. From building systems in automated and reusable ways, to upskilling people to make sure the capabilities exist to get the most out of our data rich world. Kylie is currently managing a team of data scientists and IT experts for Nicholson Consulting. Kylie holds a Master of Science (Applied Statistics) and a Bachelor of Science (Statistics and Marine Biology), both from Victoria University of Wellington. She has held previous roles as a statistician at Statistics NZ, Inland Revenue, the Ministry of Health, and most recently as the Technical Lead at the Social Investment Agency. |
Dr Paul Bracewell Paul Bracewell is a founder of DOT loves data where he leads the analytical and technical teams. Paul is passionate about analytics and how it can impact the world around us. This enthusiasm has been honed by nearly 20 years of using analytics to solve business problems and shape strategies in a range of contexts. In addition to having award-winning PhD research under his belt, Paul has been directly involved in the sale of two analytics businesses. He is an Adjunct Research Fellow within Victoria University’s School of Mathematics and Statistics where he supervises PhD and Masters Students and has also lectured within the School of Marketing & International Business. |

Markus Luczak-Roesch Markus Luczak-Roesch is a Senior Lecturer in the School of Information Management at Victoria University. His research focuses on the foundations of space and time in the context of information, as well as emergent meaning that is rooted in coincidence. The information sequences Markus is studying stem from digital traces left by humans in online communities such as Wikipedia and citizen science platforms such as Zooniverse, but also literary texts, brain wave recordings, and micro-linguistic data about language use. |
Harkanwal Singh @kamal_hothi Harkanwal is the founder of Elements Data Studio. Previously, he was the head of data journalism at the New Zealand Herald. He is passionate about developing data visualisation for communication. He will share his ideas and experience on creating data visualisation to communicate research effectively to a general audience. |
Follow-up Event
The instructor team are holding a follow-up event for all those who attended ResBaz and want to continue exploring any of the tools or lessons further in a supportive environment, or just want to extend the conversation. Participants are free to extend the invite to others who may be interested as well.If possible, please bring along a laptop and any data sets you want to interrogate or visualise. ResBaz instructors will be on hand to help.